
On Bitcoin 3: Bitcoin and Energy
On Bitcoin 3: Bitcoin and Energy

Currency is a big part of our lives and it is fundamental. We need cars, fridges, ACs, hair dryers, and so on, but we mostly need currency as a medium of exchange. Hence, if Bitcoin becomes the native currency of the internet, some energy consumption to sustain the Bitcoin network should be acceptable. Critics about Bitcoin energy should be gladly welcomed, but sometimes critics are off from reality and a bit too radical. For instance, the article “Bitcoin Mining on Track to Consume All of the World's Energy by 2020” was clearly false, which we know by now.
The Bitcoin community was aware of the energy use of it from very early days. Here is a tweet from Hal Finny on Jan/28 2009. Recall Bitcoin blockchain started in Jan/3 2009. So, just 25 days after its birth…

In this note, we wanna briefly go over energy use of Bitcoin, in comparison with Fiat, daily use products, precious metals, other Proof of Work coins. Lastly, we review some study about future carbon foot prints of Bitcoin. Though predicting the future is very challenging, there are some studies done, including BITCOIN NET ZERO by Nick Carter and Ross Stevens. The article is 60-page long, but every page is worth reading. This note consists of a lot of stuff I learned from them, so every credit goes to the authors. I also recommend a paper published by Ark investment and Square Inc (Now Block Inc) which basically says that Bitcoin incentivizes the use of renewable energy because it is cheaper. We briefly mentioned about it in my last note.
First off, I wanna see what energy means to us.
The more Energy, the better for humanity
I feel like many articles and discussions about carbon footprints generally tend to drive us not to use energy. Encouraging people to use less energy is a poor solution for the current climate change problems from macro point of view. It is certainly not good to waste energy, but consumption of energy is not a bad thing. Here is a tweet from Jack Dorsey;

A direction should be creating more energy with less costs and less carbon footprints. Here is a tweet from Clark Moody;

GDP and energy consumption are proportionally related; the more energy we have, the more productive we get. The following figures are from BITCOIN NET ZERO by Nick Carter and Ross Stevens.
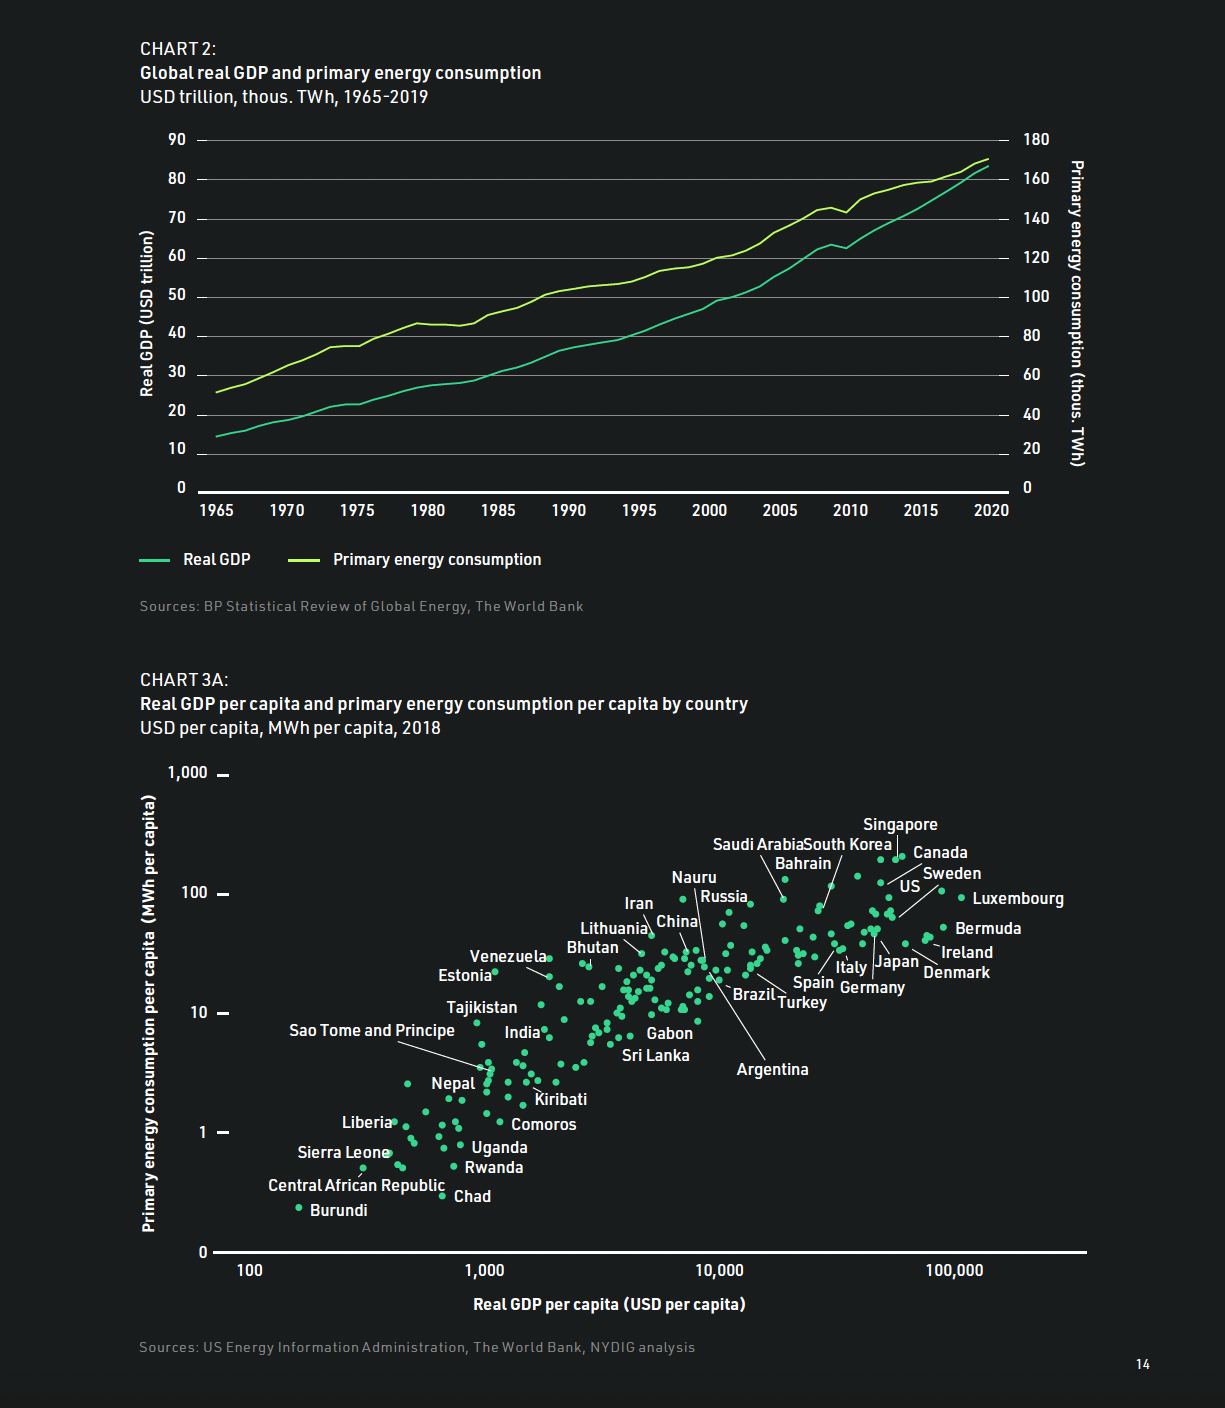
source: BITCOIN NET ZERO
The above clearly supports Dorsey’s tweet. Bitcoin’s energy use should not be discussed solely, but with its utility. We should compare with the energy use of other products with utilities. We start with some comparison with Fiat money. Ross Stevens and Nic Carter have comparison with daily used products and precious metals. We add some comparison with other Proof of Work coins.
Comparison with Fiat money
We don’t get any widely adapted monetary system for free. Fiat currency systems produce carbon as well, not only by printing money; CoinDesk reports
“You can appreciate fiat’s secondary footprint from any street corner on Earth: 80,000 bank branches and 470,000 ATMs in the U.S. alone, along with forests of skyscrapers that dominate every city on the planet. Then the part we don’t see: Finance and insurance are 8.4% of the gross domestic product in the U.S., only slightly behind manufacturing. That means millions taking the subway or driving to the office – or, the pandemic equivalent, firing up an army of laptops and call centers – to sling paper money under fiat’s harsh fluorescent glow. Visa transactions don’t even come close.“
They also speak on the recessions of fiat currency which happens every 5,6 years.
“To translate this recession cost into something that can be compared to Bitcoin, I relied on the most mainstream estimates of the carbon cost of a dollar of GDP – about 5,000 BTU (British thermal units), or 1.5 kWh (kilowatt hour), per dollar. Then, using the Federal Reserve’s own estimate of $11 trillion destroyed peak to trough in the 2008 crisis – the very crisis that inspired Satoshi to create Bitcoin – you simply multiply the two. That comes out to 16,500 TWh (terawatt hour) of carbon equivalence destroyed during that single recession. Accounting for the rest of the world, that might triple. Accounting for the other 16 recessions the Fed has given us – with more to come – makes it astronomical.“
With comparison with Bitcoin, they concluded that
“Even Bitcoin’s worst critics allege the distributed network consumes no more than 86 TWh per year, of which perhaps 16 TWh might be Americans, with much of that green energy. It would take between 500 and 1,000 years for Bitcoin’s energy use to even approach the 2008 crisis alone. With another recession permanently on the way, over and over again. That 500 to 1,000 years’ worth of energy goes on top of the 8.4% of GDP, the 80,000 bank branches and 470,000 ATMs and those skyscrapers.” [source:CoinDesk] [source:yahoo financial]
Obviously, one might think Fiat monetary system is still worth it because of its use cases. In order to compare with the Bitcoin’s energy use, we need to know the state of Bitcoin as money, and see how much carbon footprints are reasonable for Bitcoin.
The state of Bitcoin as money
Bitcoin is a legal tender in El Salvador and Central African Republic. In smaller scales, the Swiss city of Lugano made it legal tender. [source] Rio de Janeiro is planning to enable their people to pay tax by Bitcoin. [source] Famous athletes like Russell Okung and Odell Beckham Jr. chose to get paid in Bitcoin. [source] Mayor of Miami and New York are getting paid in Bitcoin as well. [source] The number of active bitcoin addresses are constantly growing. [data]
Let’s look at the transaction volume. According to data from a cryptocurrency investment firm NYDIG, Bitcoin transaction volume eclipsed $3 trillion in payment transactions in 2021, surpassing American Express ($1.28 trillion) and Discover ($0.5 trillion). Master had $7.72 trillion and Visa had $13.5 trillion. [source] According to this source which seems to be the original source, the above calculation has been done with careful estimates removing transactions without economic substance by looking at changes in UTXOs and excluding between addresses within the same wallet or owned by the same organization.
We also review estimates done by ARK investment, and they concluded that “Bitcoin's annual settlement volume has officially surpassed Visa's. More than $13.1 trillion of value was settled on-chain in 2021.”


I would like to be corrected if I’m wrong here, but I think we never know the exact amounts. I do not think there is a way to detect precisely since we have some privacy in public keys and bitcoin addresses. Of course, on-chain data is accurate, and one of the best source for this is Glassnode. However, on-chain data does not capture transactions between entities using an intermediary to settle their transaction outside of the blockchain layer; for instance, two traders on an exchange’s internal order-book. The above off-chain studies consider them, but estimates are all different.
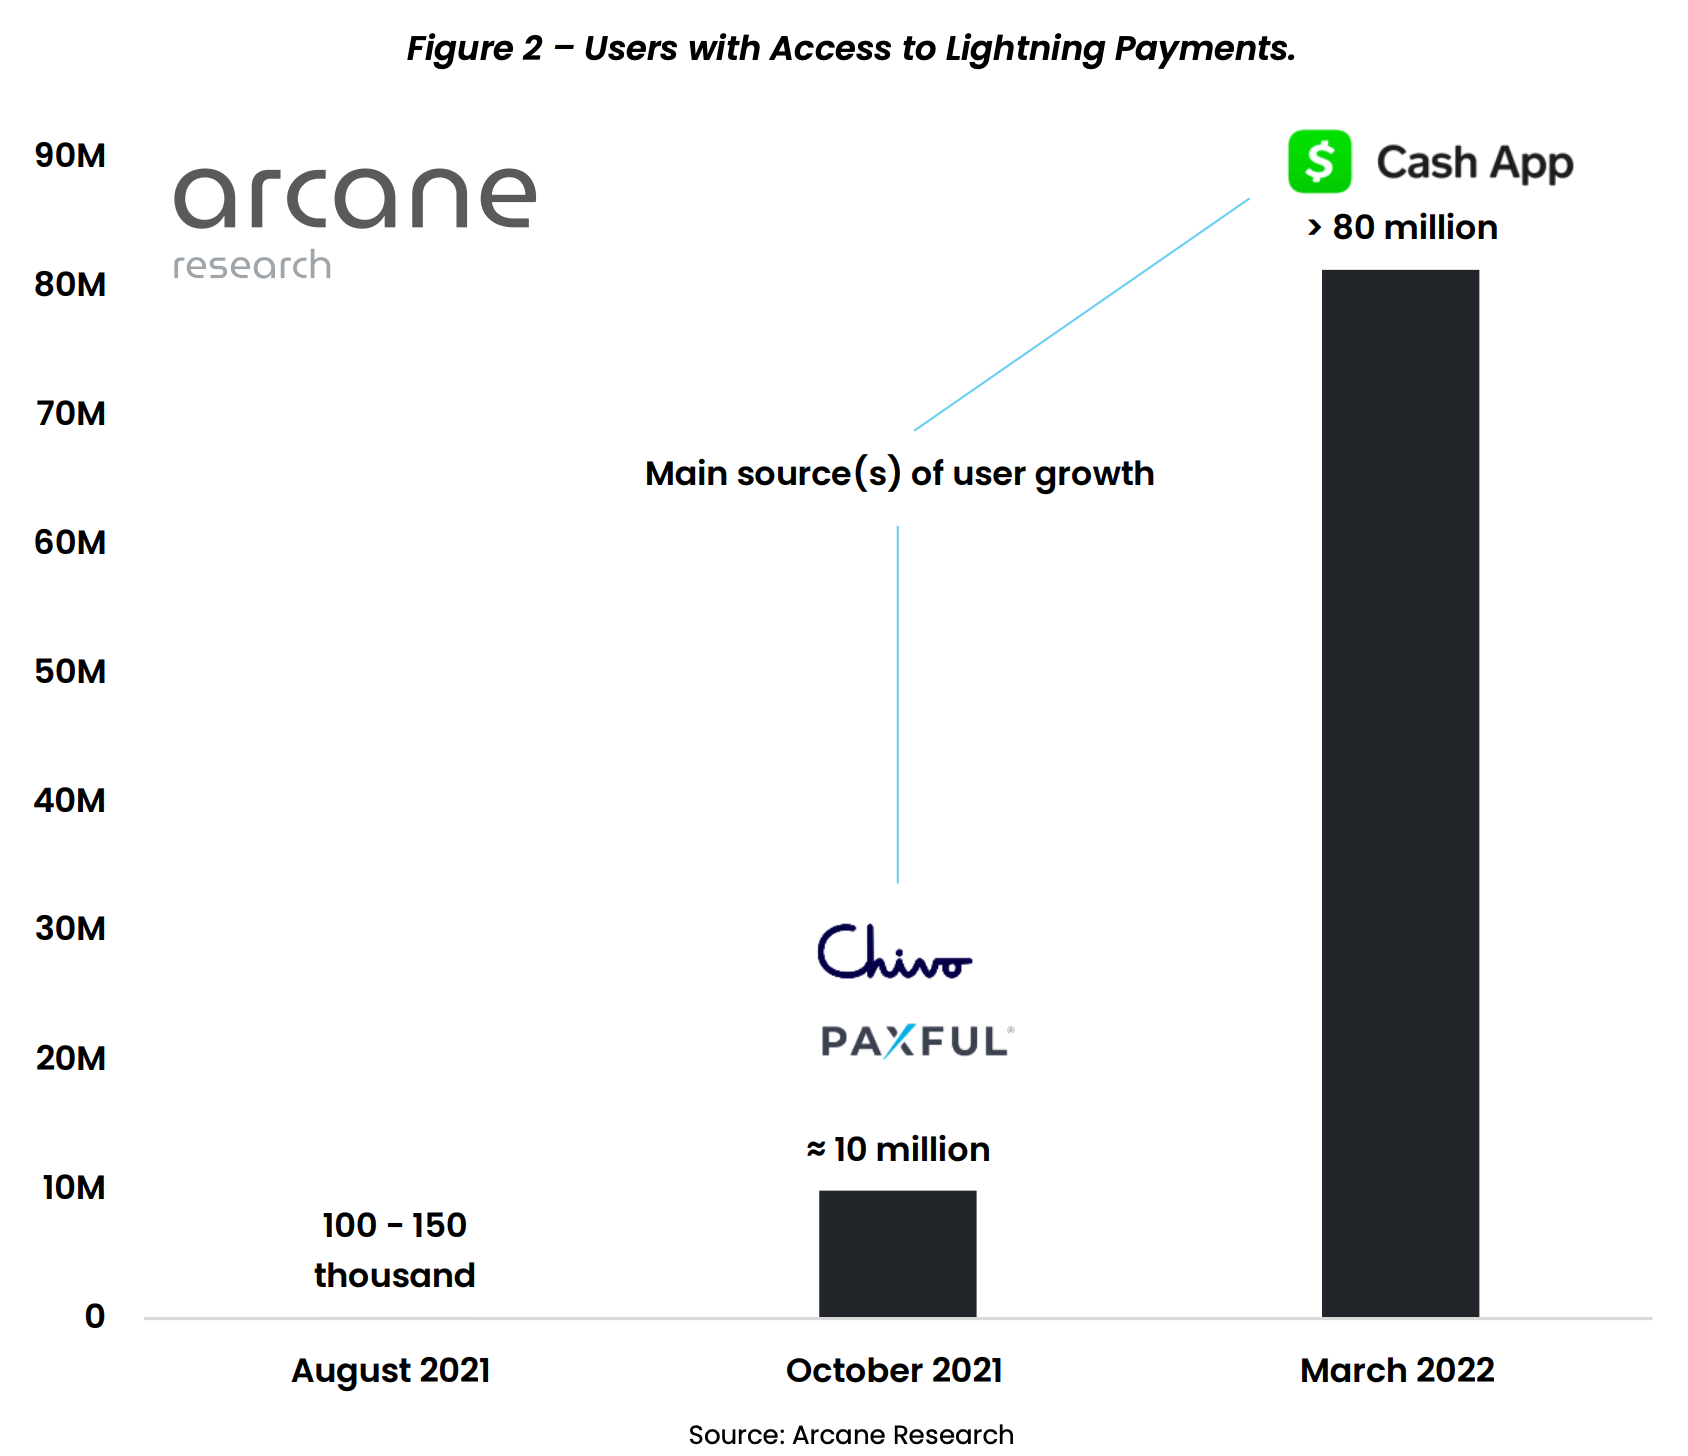
That said, I think it is fair to say that Bitcoin transaction volume is surging. Now, like in El Salvador, a lot of micro payments are done in lightning network; every metric on lightning network is surging. (Some of the sources to learn about the state of Lightning is reports of arcane research.)
First, the number of people who are able to access to lightning network dramatically increased lately because Cash App integrated. I’m also excited for Cash App’s growth with this integration as a financial service. In Fiat systems, they have to consult with regulations in each country to open up business, but with Bitcoin they have less hurdle because they would money on Bitcoin network. Especially, with the leadership of Jack Dorsey and his support on Bitcoin, we might be seeing Bitcoin adaptation even faster from now on.
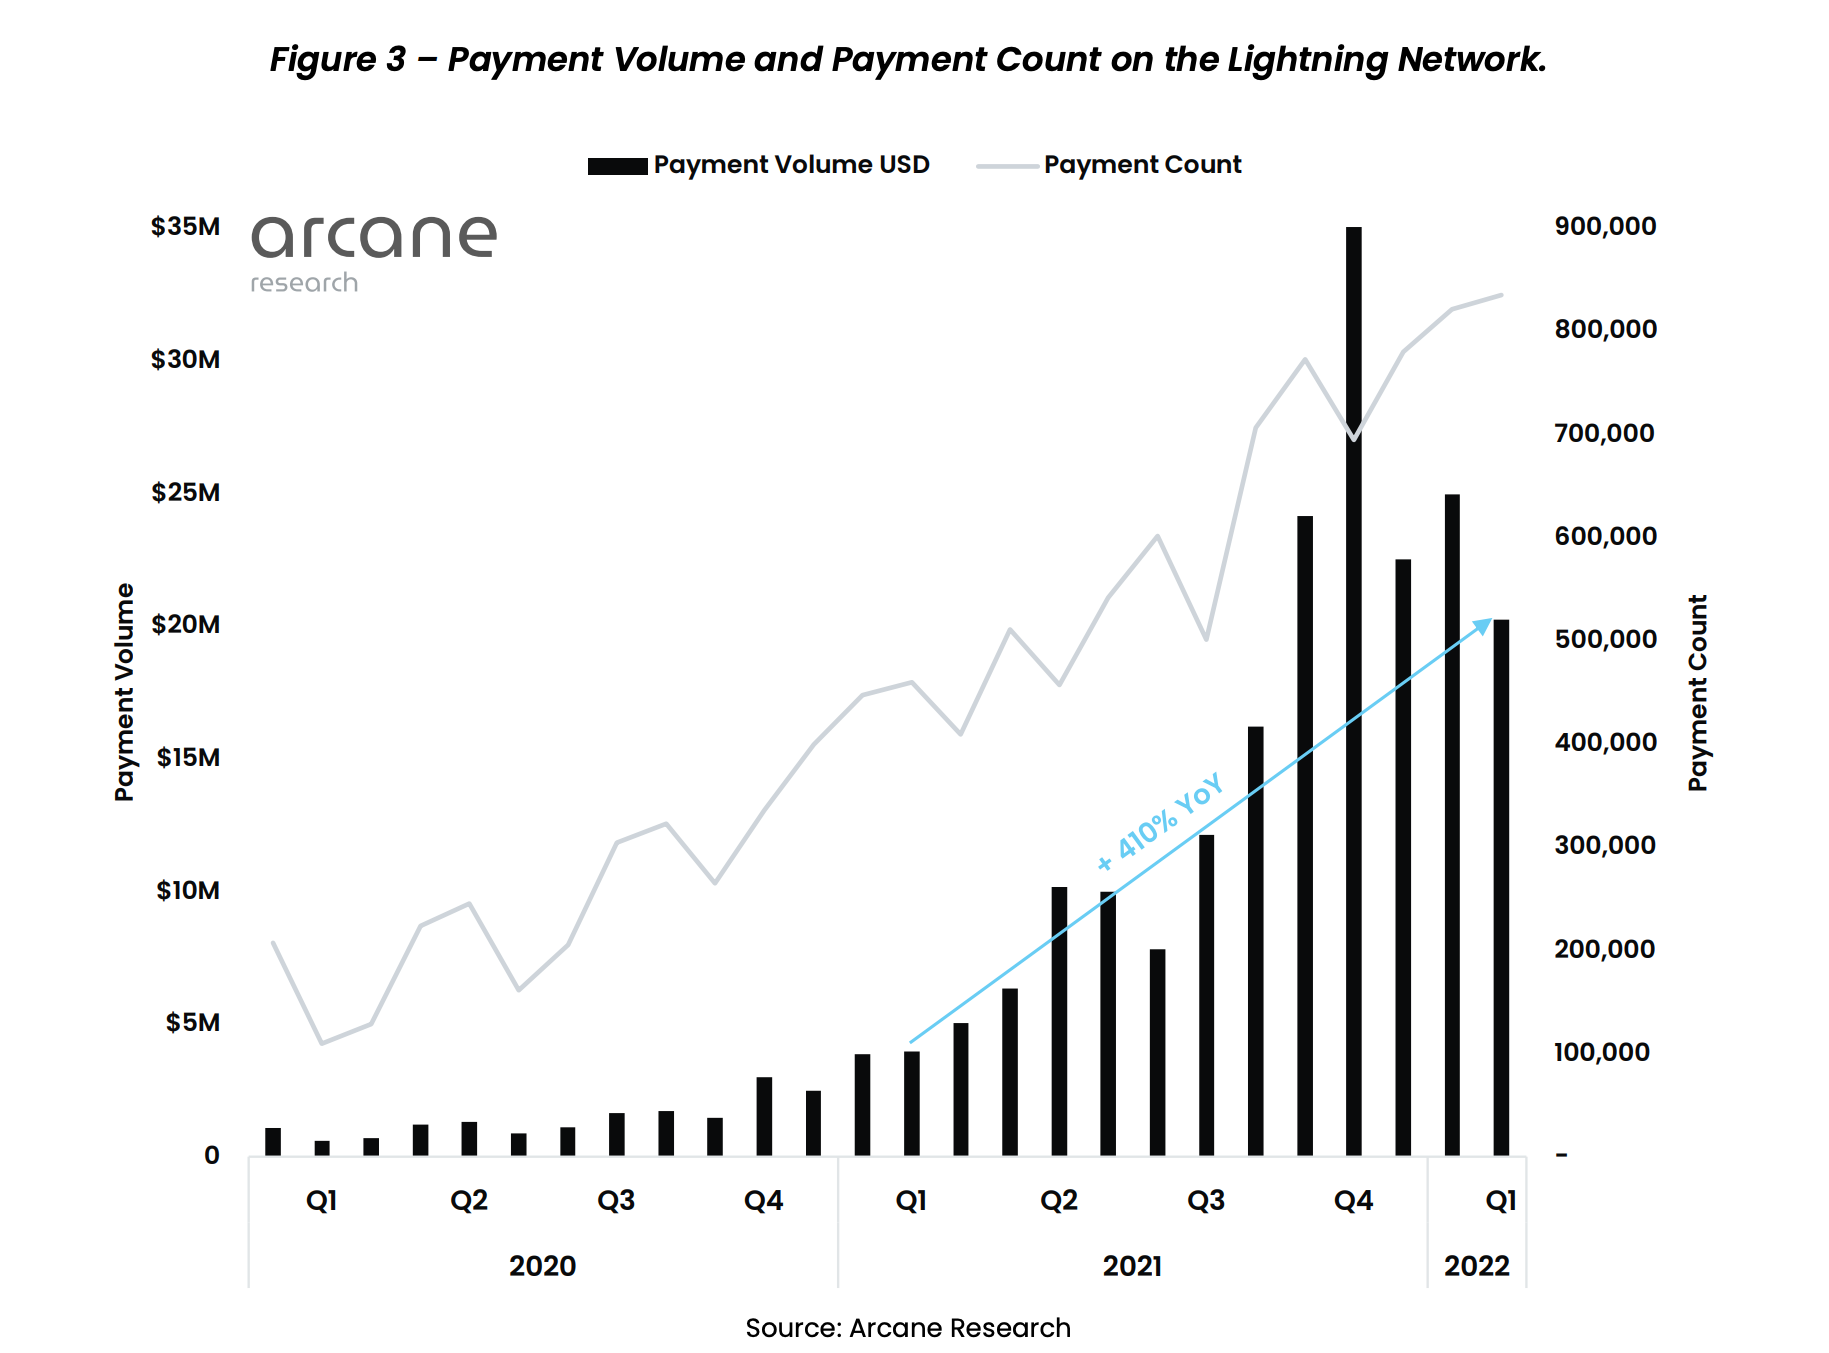
Actual Payment volume and payment count are also surging. We can see that 2022 Q1 grew by 410% from 2021 Q1.
Whether the state of Bitcoin as money is good or not depends on each individual, the data is here and you can decide your position.
Now that we have some idea about the utility of Bitcoin, we review some comparisons in terms of energy use.
Some other comparisons
Daily used product
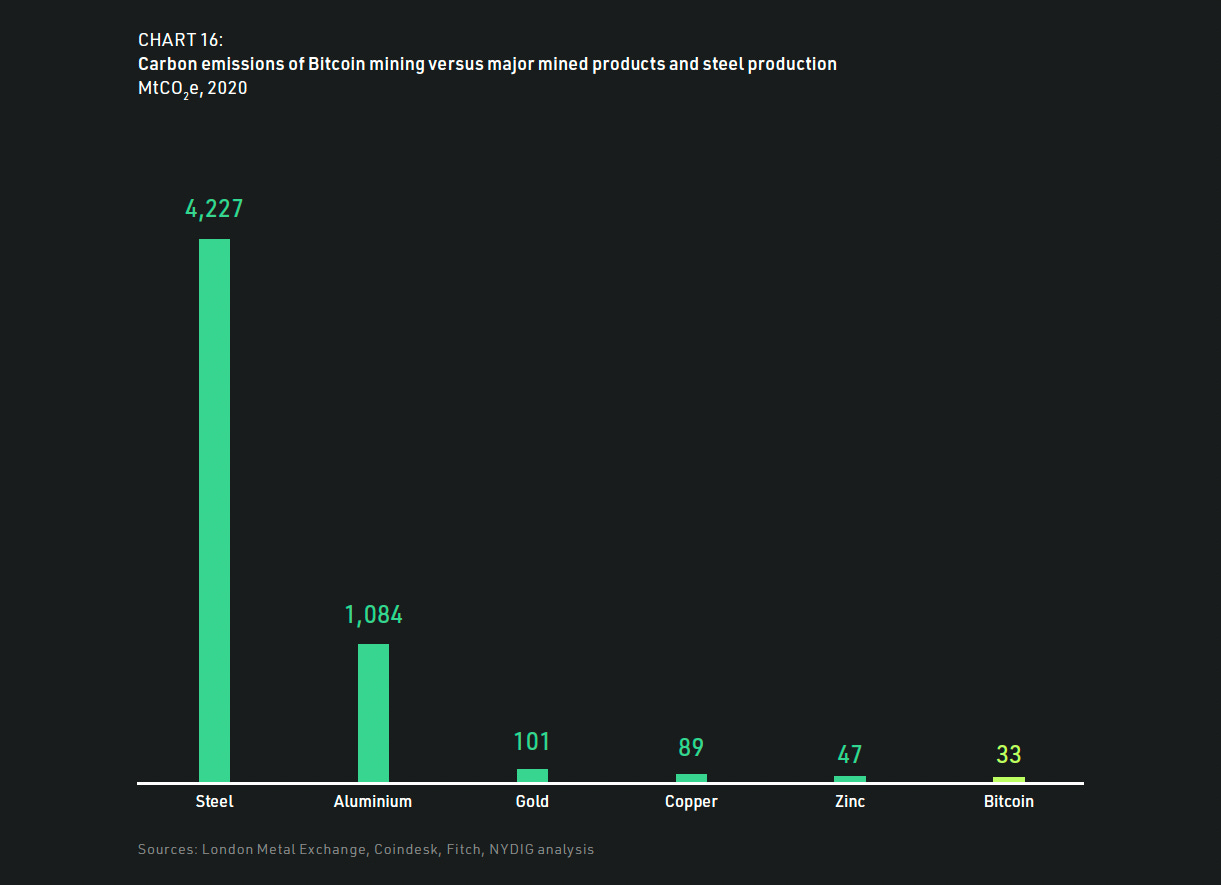
This is the direct quote from the article of Nic and Ross. “We estimate that Bitcoin consumed 62 TWh of electricity in 2020, which resulted in 33 million tonnes of carbon dioxide emissions, insignificant in global terms, representing just 0.04 percent of global primary energy consumption and 0.1 percent of global carbon emissions. Bitcoin’s electricity consumption is also low compared to other energy-intensive modern conveniences, such as domestic refrigeration (630 TWh) and domestic tumble dryers (108 TWh).”
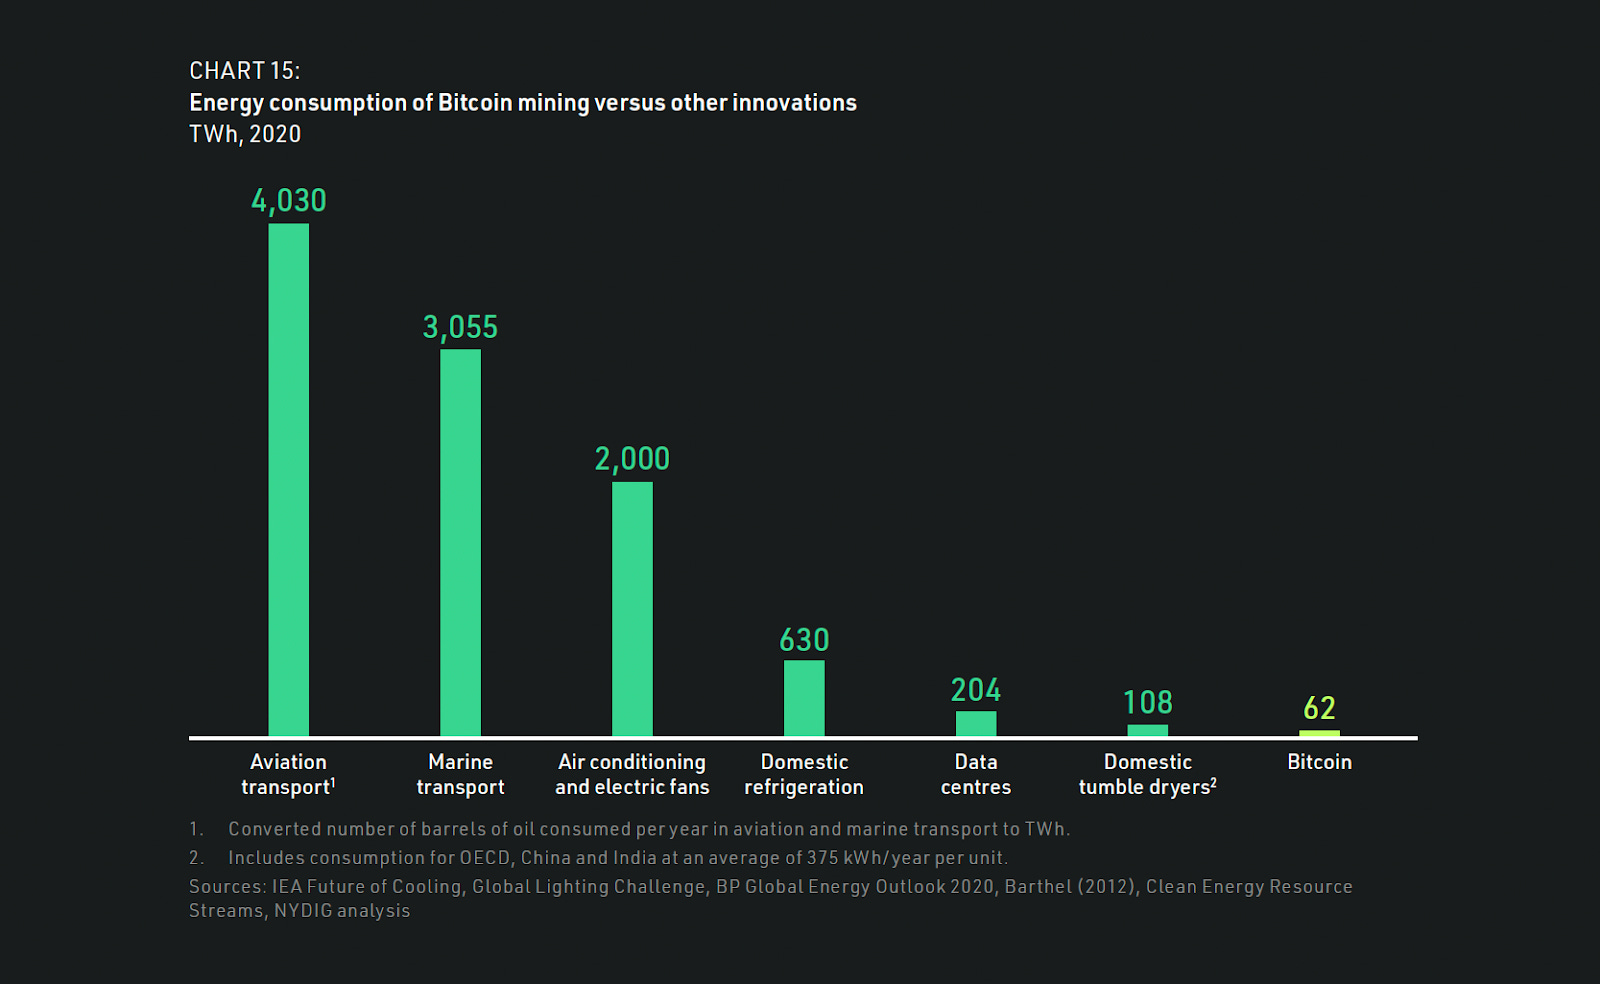
source: BITCOIN NET ZERO
Bitcoin is a software, and comparing with data centers including those of Google and Social Media companies, we get some taste here. There are different estimates reported in Dec/2021 perhaps due to timing; this article says “The world's first and biggest cryptocurrency eats up 143 terawatt-hours of power annually, more than the usage of many medium-sized European nations, according to data provider TradingPlatforms. For perspective, global data centres consume 205TWh yearly; Bitcoin alone consumes 70 per cent of this figure.“ They continue “Alphabet-owned Google, the world's biggest search engine, uses 12TWh, which is about a 12th of Bitcoin's energy use. Meta Platforms' Facebook, the world's largest social network, pales even further in comparison, requiring only 5TWh for its functions – 3.5 per cent of what the cryptocurrency needs.“
Precious metals
source:BITCOIN NET ZERO
Let’s see the market cap of some of those precious metals and see how efficient they are in terms of carbon emissions. Every number comes from Statista.
Gold: 3030 million tons produced in 2020, average value is $1769 Average gold price in U.S. dollars per troy ounce. 3030 million metric tons is 9.7417e+7 troy ounce, so multiplying $1769, we gives us the total valuation of $172 billion. [production data] [price data]
Zinc: 12.24 million metric tons produced in 2020, average value is 2,266 Price in nominal U.S. dollars per metric ton, which gives us the total valuation of $27 billion. [production data] [price data]
Copper: 20.6million metric tons produced in 2020, average value is 6,181 U.S. dollars per metric ton, which gives us the total valuation of $127.3 billion. [production data] [price data]
Bitcoin: By looking at circulation, 18.59-18.19=0.4 million bitcoins were mined in 2020, because the lowest price of bitcoin is $6500 and the highest price of bitcoin is $30000, which gets us $2.6 billion to $12 billion. [production data] [price data]
So, just by looking at value per carbon emission, bitcoin is not the best.
PoW coins
In the paper The Cost of Bitcoin Mining Has Never Really Increased, the authors considered mining cost per transaction volume on daily bases in Bitcoin, they found out that the mean value of the ratio was about 0.21% over the period after 2014, and 0.3% over the period after the end of 2017. They concluded that there is actually a small negative correlation between the two for the daily variations. One can do a similar analysis with other coins, but for simplicity, we could consider market cap per energy.
The paper Energy Consumption of Cryptocurrencies Beyond Bitcoin summarized them all. They considers Market Cap per rated power. Rated power means that they estimate power in terms of the efficiency of mining hardwares and net hash rates. The authors add that this estimate is not accurate; in Pg 6 of the paper, they say “ Our estimate does not include power usage effectiveness (e.g., losses due to cooling, or cable and transformer losses), or other auxiliary energy costs (e.g., GPUs require additional hardware such as a mainboard or CPU). Additionally, the rated power is not equal to measured (and consumed) power of devices. Such aspects add further uncertainty to the absolute energy consumption figures per single cryptocurrency, as we directionally underestimate the energy consumption compared to other approaches (as seen in Table S1, and as suggested by the comparison of our results with more sophisticated methodologies for Bitcoin (see main body for details)). However, as this inaccuracy applies to all examined cryptocurrencies, potential changes in absolute numbers would likely impair the estimates of all cryptocurrencies in a similar manner, and not impair the relative shares. Future research into understudied coins (besides Bitcoin) may provide more certainty on absolute figures”
That said, the below is the data from them.
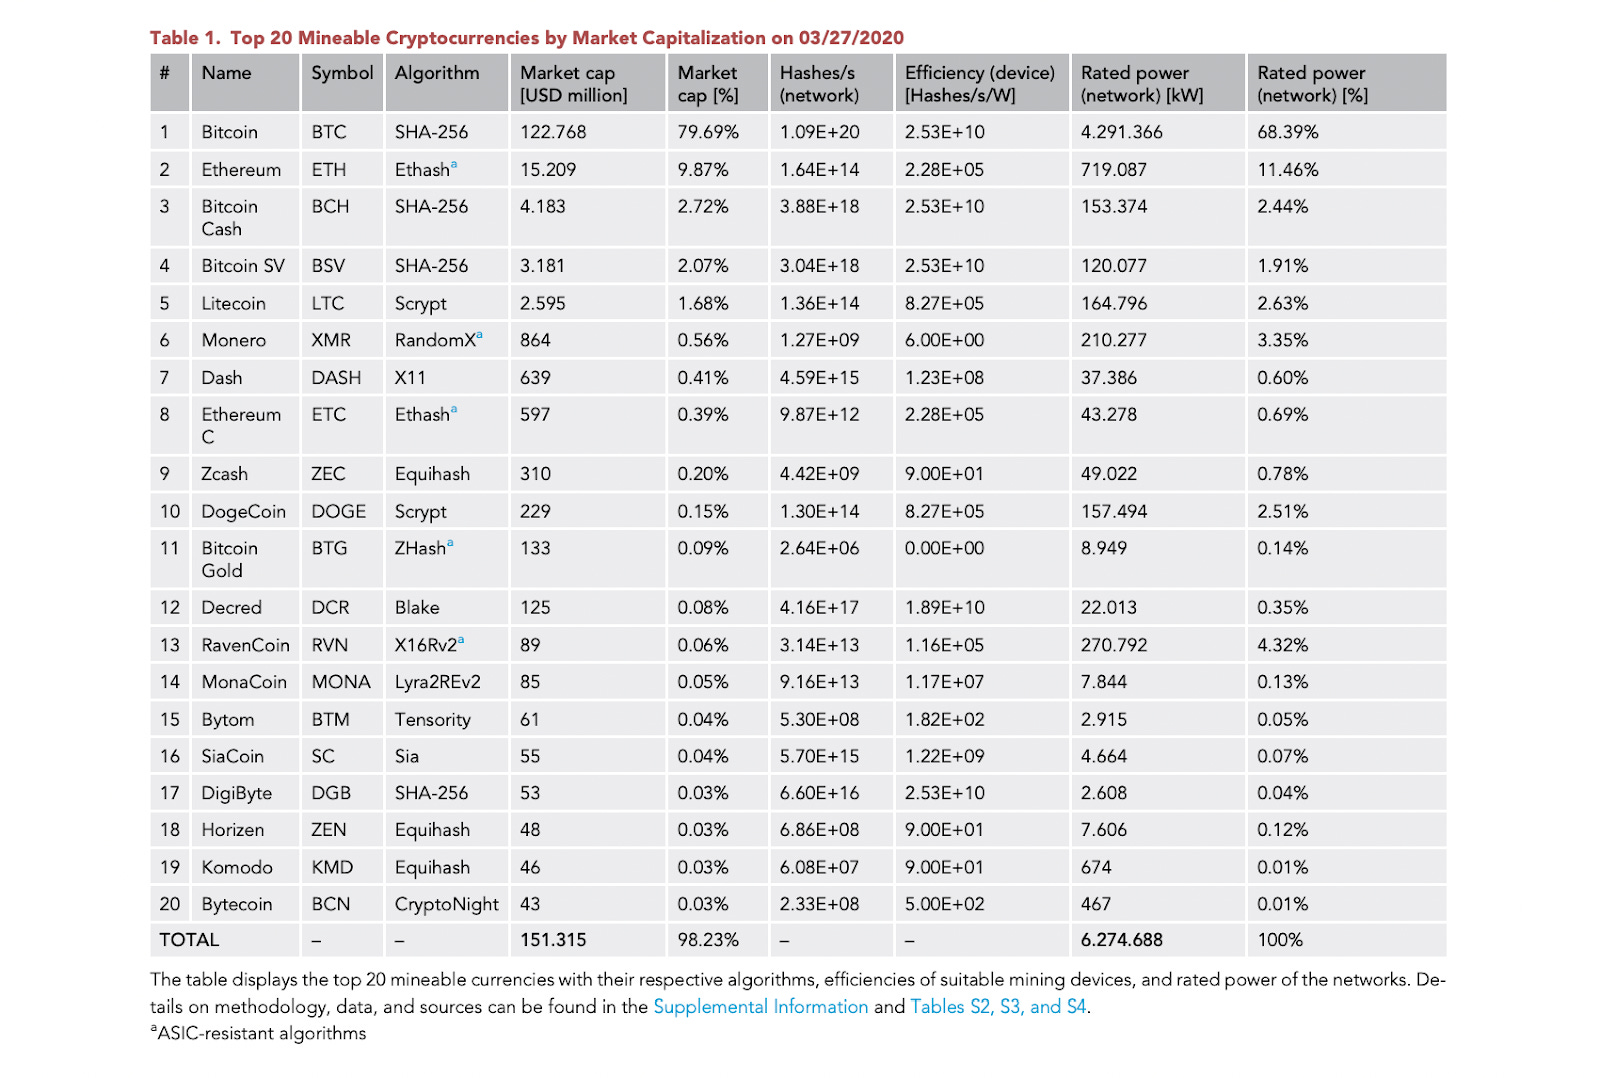
It makes sense to compare with SHA-256 PoW coins because they use the same ASIC miner and a lots of other non-included energy expense like cooling can be assume to be proportional. Bitcoin has 79.69% market cap with 68.39% rated power and Bitcoin Cash has 2.72% market cap with 2.44% rated power. Obviously more market cap with less rated power is better. Hence Bitcoin contributes better to carbon emission in this sense.
Lastly, let’s talk about the future.
Future carbon footprints
At present, Bitcoin takes 0.04 percent of global primary energy consumption, 0.2 percent of global electricity generation, and 0.1 percent of global carbon emissions. The authors of BITCOIN NET ZERO predict the future carbon footprints with 4 cases in terms of prices of bitcoin. The below are their definitions of 4 cases, directly taken from the article.
<Case1> High price: assumes that Bitcoin will equal gold’s historical average value as a store of global wealth. Bitcoin’s market value would rise to a nominal value of $10 trillion in 2030, implying a price of around $490,000 per bitcoin. Between 2030 and 2040, Bitcoin’s price would continue to grow at a slower rate of 2 percent per year, rising to $595,000 in 2040.
<Case2> Medium price: assumes that Bitcoin will equal half the historical average value of gold as a store of global wealth. Bitcoin’s market value would reach a nominal value of $5 trillion in 2030, implying a price of around $245,000 per bitcoin. Between 2030 and 2040, Bitcoin’s price would continue to grow at a slower rate of 2 percent per year, rising to $300,000 in 2040.
<Case3> Base price: assumes the price would grow at a rate of 2 percent per year from the February 2021 average of approximately $50,000, rising to around $60,000 in 2030 and $75,000 in 2040.
<Case4> Low price: assumes that the Bitcoin price would decline to $10,000 in 2030, which is in line with the 2020 average. Between 2030 and 2040, Bitcoin’s price would grow at a rate of 2 percent per year, rising to $12,000 in 2040.
With those 4 cases, they estimated future carbon footprints.
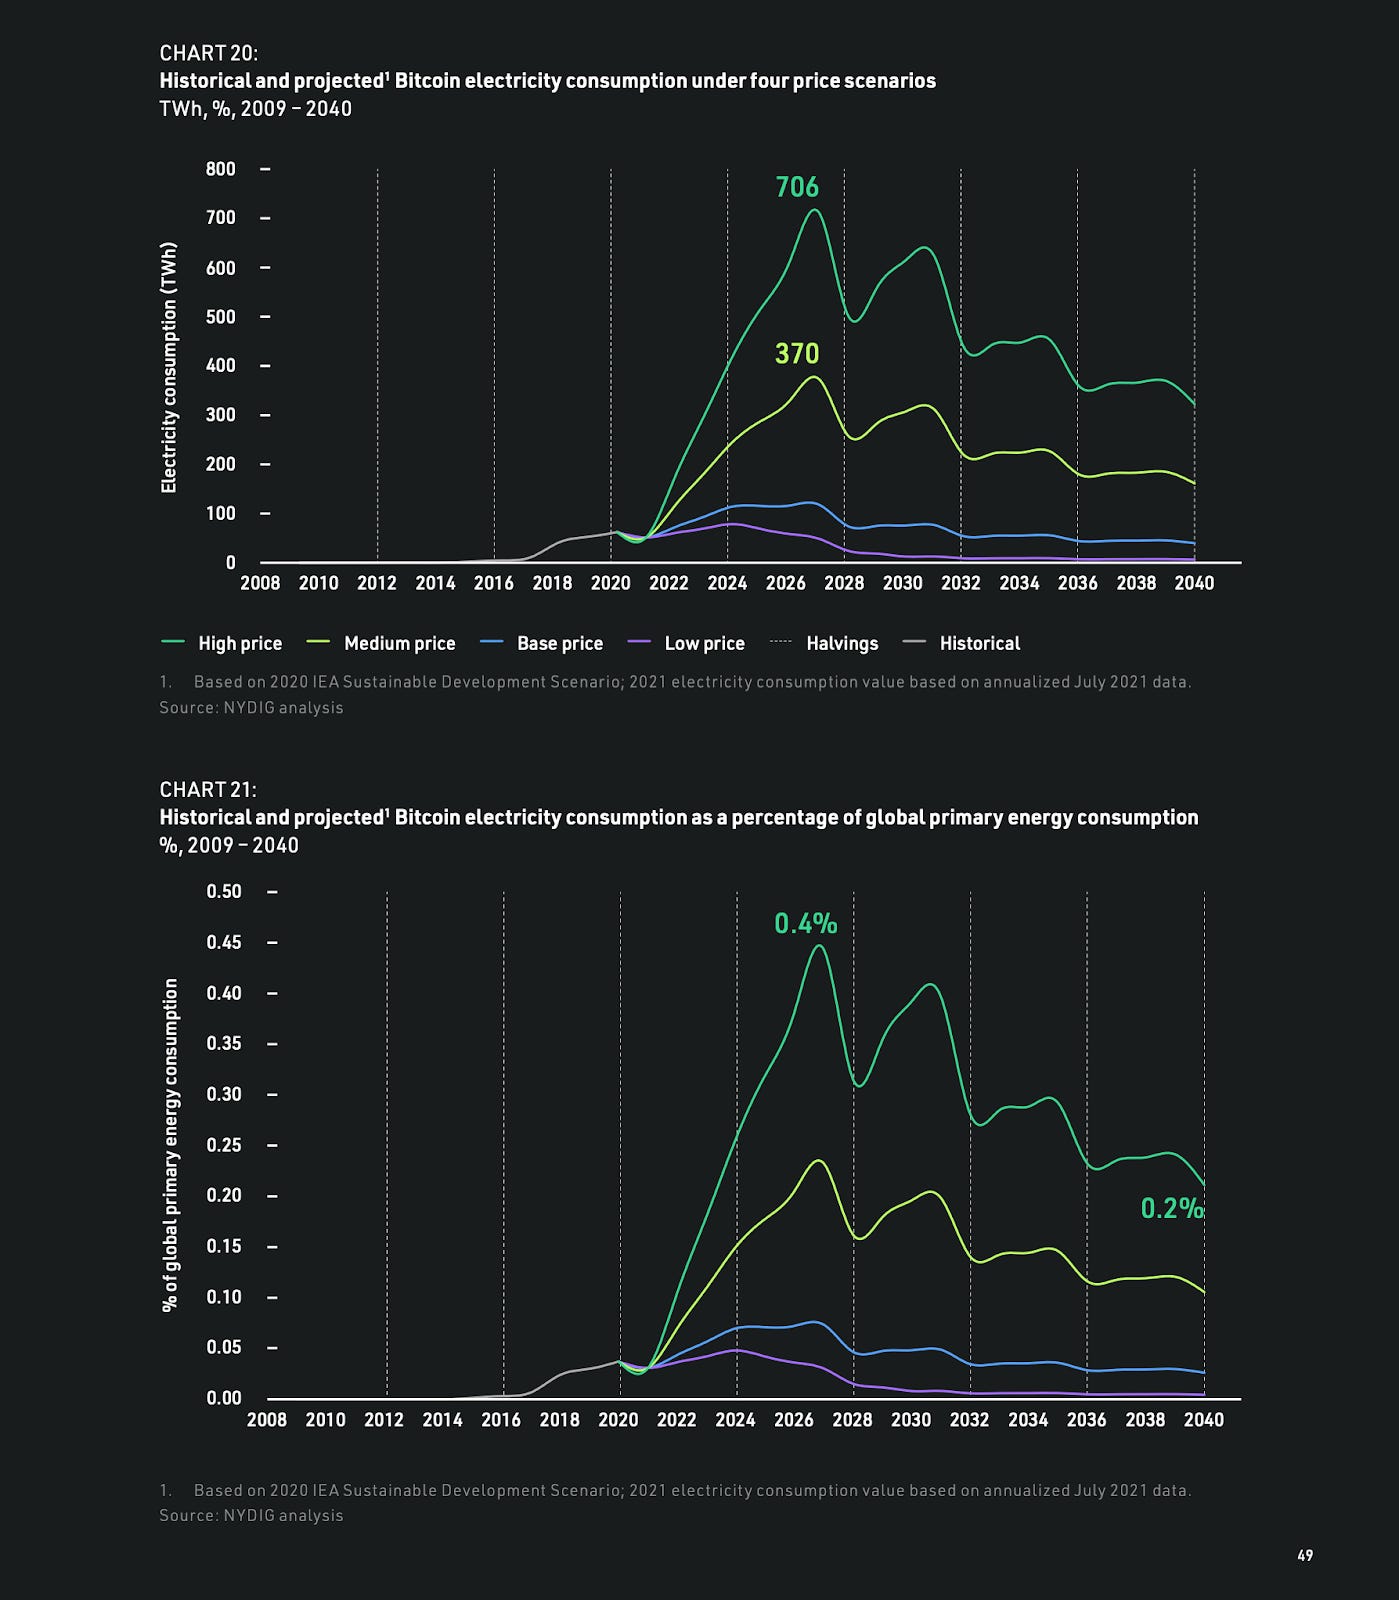
source:BITCOIN NET ZERO
They conclude that “even in our most aggressive, high price scenario, in which Bitcoin reaches $10 trillion by 2030, its emissions amount to only 0.9 percent of the world’s total, and its energy outlay is just 0.4 percent of the global total. These figures were calculated without consideration of the observable acceleration in the use of offsets, renewable energy, renewable energy certificates, and waste energy.”
The US is the leader
Recent survey reported in Sep 2020 by Cambridge Centre for Alternative Finance (CCAF) estimated that on average 39% of proof-of-work mining is powered by renewable energy, primarily hydroelectric energy. [source] Meanwhile, in Q4 of 2021, it is estimated that 58.5% of bitcoin mining is done by renewable energy. [source]
Kazakhstan, where fossil fuels, including coal, produce more than 90 percent of the nation’s electricity supply. [source] The current contribution of Kazakhstan to bitcoin mining is roughly 15%, which is the second biggest share after the US. It seems that the country is disincentivizing bitcoin mining by taxing it. [source] This is not great for geographical decentralization, but it is for carbon emission.
The US is clearly a leader both in hash rate and green mining at this point. A lot of companies are embracing green Bitcoin mining, including Greyton digital Mining, Great American Mining Company , Riot blockchain and much more.
Rest of the world also has a huge chance in contributing into green bitcoin mining; the following tweet from Adam Back, CEO of Blockstream and one of notable figures in Bitcoin community, is a hope.


This article is one of such example. A Costa Rican hydropower plant has transformed into a green crypto-mining operation because they could not sell their energy because the country has a surplus of renewable power.
Lastly, fun stuff to watch
I heard of a story of a home miner heating up his house with Bitcoin mining. Bitcoin mining prefers colder climates, so makes sense, but made laugh a bit. There are other funs stuff as well.
Kryptovault, Norway’s largest data centre and Bitcoin Miner is not only using regenerative hydropower to power its mining operation. It uses waste heat to dry wood.[source]
Bitcoin Bloem, a Bitcoin mining company based out of the Netherlands, is using excess heat from Bitcoin mining to heat greenhouses.[source] There was a twitter buzz on this.

Next note
In the next note, I would like to get into some of my thought on Bitcoin, also sharing some great wisdom from other sources. The below is the keynote of Charles Hoskinson, the founder of Cardano, at Biance conference in Dubai. Hoskinson claims that we still don’t have the definition of Decentralization, and asks the audience. (around 4:00)
Decentralization tends to lead more than anything in crypto. Yet, what is decentralization? I don’t claim that I have an answer, but certainly the definition should depend on people. It is worth pointing out that even if there is a universal definition of decentralization, “decentralizing everything” does not necessarily mean a good thing. For instance, if you have your bitcoin in centralized exchanges, that is not owning your coins, but many people choose these custodial wallets. There are various risks to count on a central entity, but there are also risks for you to lose your private key. We should also note that crypto adaptations are surging in Africa and Southeast Asia, and they do not necessarily live in environments or households where they could securely hide their keys. Simply making everything decentralized does not seem to be a good idea. It all depends on the utilities of actual people.
It is important to have a mind like “This is a problem, but decentralization solves it”. Generally, problems arise from various attacks including hacking. While there are preferences in layer 2, like holding and spending bitcoin, we all hope the security of layer 1. Mining plays a key role therein, hence I plan to talk about mining in the next note. The health of mining can be measured by various data such as Hash Rate, Hash rate Distribution, Miners Revenue, and so on. [data] Yet, voices of miners seem to be missing. There are some studies about it, and we will share in the next note. This would helps us to understand potential problems which could cause miners to stop mining, hence would be important when we thinking about decentralization of mining in future notes.
We’ve seen many light discussions on this matter; for instance, mining is decentralized if hash rates are well distributed. But, what do you mean by well distributed? Does it mean that we have 10 mining pools each of which contributes 10% in hash rates? What if 8 of them belong to one country and they all get banned by their local governments? This is a complicated problem.
There are quantifications which measure some aspects of mining distribution, such as Gini coefficient, Shannon Entropy, and Nakamoto coefficient. They all measure different aspects in mining. We also plan to give one which measures the vulnerability from particular attacks. Let’s start diving in from the next note.
Thanks for reading.